
Fig. 1: Schematic sketch for the setup of the
Reynolds number experiment
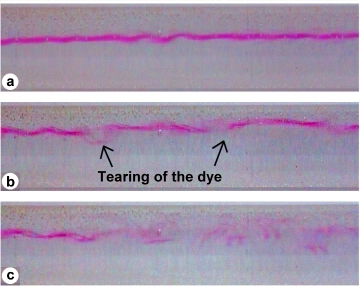
Fig.
2: a) red line of the dye at laminar flow, b) fluctuations and breaking of the
dye thread at the transition point, c) unordered movement of the dye at turbulent flow
Multimedia in Physics Education
A video for the quantitative analysis of the Reynolds number
Andreas Wagner, Stefan Altherr, Bodo Eckert, Hans Jörg Jodl
University of Kaiserslautern, Department of
Physics
Erwin-Schrödinger-Straße, 67663 Kaiserslautern, Germany
Abstract
The video of the Reynolds Transition
Experiment, developed for physics teaching, shows the continuous transition
from laminar to turbulent flow. Additionally, the critical Reynolds number of
the experimental setup is determined approximately. By looking at it, the user of the video can measure all necessary data and than calculate his
result.
The original experiment by Reynolds in 1883 allows one to observe either the laminar or turbulent behaviour of a water flow [1]. But existing videos of the Reynolds dye experiment show only the qualitative aspect of this phenomenon [2]. A video “Farbfadenversuch nach Reynolds” developed at the University of Kaiserslautern enables the learner to observe this transition of flow behaviour and to determine the critical Reynolds number of a pipe flow as the flow rate is continuously increased during the video experiment. This topic – ideal/laminar/turbulent flow, Reynolds number, similarity laws – is still taught in the context of fluid mechanics at school and university level, because of its relevance in the curriculum of physics as well as its technical importance (aircraft wings in a flow channel, turbulent flow through tubes).
It is a problem to demonstrate this in a regular course at school or university due to experimental difficulties. The experimental procedure may need to be repeated several times due to a badly injected dye. Furthermore the experimental setup is sensitive to external vibrations. In addition to setup and experimentation details, the video contains the theoretical background described by Sommerfeld and data analysis.
Initially the real experimental setup is described step by step in all details (fig. 1). One attaches a discharge pipe with an inner diameter 2r horizontally to a vertical water-filled cylinder with an inner diameter of 2R. The flow rate may be varied with a valve at the end of the pipe. For the visualisation of the flow behaviour one uses a potassium permanganate solution as a dye liquid, which is injected centrally into the horizontal pipe. This tube must be as small as possible in diameter (about < 1mm) and well positioned to avoid additional turbulences. During the experimental procedure we have chosen a modified approach in relation to the literature on fluid dynamics. Instead of leaving the flow rate constant, one continues to open the valve. Thus the flow rate increases continuously and the transition from laminar to turbulent flow is made visible by the dye (fig. 2).
|
|
|
Systematic investigations resulted in the fact that the dimensionless critical Reynolds number Rekrit gives empirical values for the transition from laminar to turbulent flow. The definition of the Reynolds number Re is :
At values less than the critical Reynolds number Rekrit perturbations are damped in the flow by the viscosity of the liquid. Above this number the inertia forces of the particles are larger than the friction forces of the fluid.
In order to be able to determine the critical Reynolds number of the configuration, we have to measure the changing flow rate, i.e. u(t). The video shows simultaneously the cylinder with length scale, a real time display, the flow and additionally the measured time dependence of the level of liquid (fig. 3) by means of inserts.
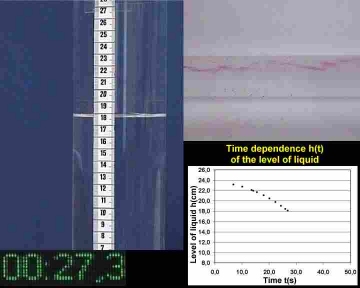
Fig.
3: Subdivided view for recording measurements (top left: level of liquid with
length scale, down left: time indicator in seconds, down right: measuring
points of the time dependence of the level of liquid, top right: pipe flow)
Since the transition of laminar to turbulent
flow does not happen at a given transition point (first fluctuations, then
breaking of the dye thread, then unordered dye flow), we had chosen the time, on
which the dye thread is breaked the first time.
In this example one can fit analytically the
time dependence h(t) of the level of liquid by a quadratic equation with
a relative error of less than 4%. The average flow rate u in the
horizontal pipe is given by the conditions of the spatial constant flow rate I.
As a result, one obtains the continuity equation:
In order to calculate the critical Reynolds number from the average speed ukrit at this transition point, we use the well known equation
for the „infinitely long“ water flow without dye injection in a pipe with circular profile [3]. Here r is the density of the fluid, 2r is the inner diameter of the discharge pipe, ukrit is the average flow rate at the transition point and h is the dynamic viscosity of the fluid. In our example the critical Reynolds number is approximately 1600. This means a deviation of around 700 compared to the literature value of 2320 in such a case [3].
Text books about fluid mechanics induce the mistaken idea to the reader that the transition occurs always at approximately Rekrit = 2320 [3]. The reason for this misconception is the clear difference between the Reynolds dye experiment and the derivation of the critical Reynolds number of an infinitely long pipe. As the text books describe correctly, the observable transition to turbulent flow depends crucially on the geometry. Not only the geometry of the pipe plays a role here, but also the geometry and quality of the injection tube of the dye liquid. This explains the deviation of the measured critical Reynolds number from the literature value.
Already Arnold Sommerfeld referred in its lectures on theoretical physics about this deviation [4]. He stated that the boundaries of the critical Reynolds number are for instance about 1200 (very irregular intake) and 20000 (good rounding of the inlet).
Further information
The video
„Farbfadenversuch nach Reynolds“ and further multimedia are available from the authors on CD-ROM for a
protective charge. One can find
additional information on the internet page of PEN (Physics Education Network,
http://pen.physik.uni-kl.de) under the column "Information -
Unterrichtsmaterial".
Literature
| [1] |
Reynolds, O.: On the experimental investigation of the circumstances which determine whether the motion of water shall be direct or sinuous, and the law of resistance in parallel channels. In: Phil. Trans. Roy. Soc. 1883 (174), p. 935-982. |
|
[2] |
Selected Examples are: |
|
[3] |
Rödel, H.: Hydromechanik. Seventh revised edition, München/Wien: Carl Hanser Verlag, 1974. |
|
[4] |
Sommerfeld, A.: Vorlesungen über theoretische Physik - Band 2: Mechanik der deformierbaren Medien. Sixth edition, Frankfurt am Main: Verlag Harri Deutsch, 1992, p. 105. |